
Type Data Output from weather Radar : others
Accumulations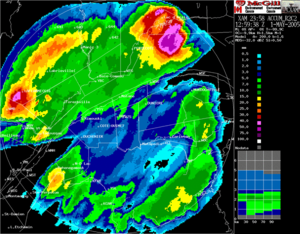 One of the main use of radar is to be able to assess the amount of precipitations fallen over large basins for hydrological purpose. For instance, river flood control, sewer management and dam construction are all areas where planners want accumulation data. It ideally completes surface stations data which they can use for calibration.
To produce radar accumulations, we have to estimate the rain rate over a point by the average value over that point between one PPI, or CAPPI, and the next; then multiply by the time between those images. If one wants for a longer period of time, one has to add up all the accumulations from images during that time.
Echotops
Aviation is a heavy user of radar data. One map particularly important in this field is the Echotops for flight planning and avoidance of dangerous weather. Most country weather radars are scanning enough angles to have a 3D set of data over the area of coverage. It is relatively easy to estimate the maximum altitude at which precipitation is found within the volume. However, those are not the tops of clouds as they extended to higher altitudes than the precipitation.
Vertical cross sections
To know the vertical structure of clouds, in particular thunderstorms or the level of the melting layer, a vertical cross sections product of the radar data is available to meteorologist. This is done by displaying only the data along a line, from coordinates A to B, taken from the different angles scanned.
Range Height Indicator
When a weather radar is scanning in only one direction vertically, it obtains high resolution data along a vertical cut of the atmosphere. The output of this sounding is called a Range Height Indicator (RHI) which is excellent for viewing the detailed vertical structure of a storm. This is different from the vertical cross section mentioned above by the fact that the radar is making a vertical cut along specific directions and does not scan over the entire 360 degrees around the site. This kind of sounding and product is only available on research radars.
Radar networks
Over the past few decades, radar networks have been extended to allow the production of composite views covering large areas. For instance, all major countries (e.g., the United States, Canada, much of Europe) produce images that include all of their radars. This is not as trivial a task.
In fact, such a network can consist of different types of radar with different characteristics like beam width, wavelength and calibration. These differences have to be taken into account when matching data across the network, particularly to decide what data to use when two radars cover the same point. If one uses the stronger echo but it comes from the most distant radar, one uses returns that are from higher altitude coming from rain or snow that might evaporate before reaching the ground (virga). If one uses data from the closest radar, it might be attenuated passing through a thunderstorm. Composite images of precipitations using a network of radars are made with all those limitations in mind.
Post a Comment